


































Silhouettes of cheering fans with raised fists at a sports stadium with text: Turn fan data into actionable intelligence.
Elevate's proprietary software helps organizations transform first-party data into clear insights for strategy, partnerships, and growth.

See EPIC in Action
Blurred motion of soccer players running on field at night with one player about to kick the ball.

Turn fan data into actionable intelligence.

EPIC helps teams connect data, spot opportunities, and act faster across ticketing, partnerships,
and fan engagement.

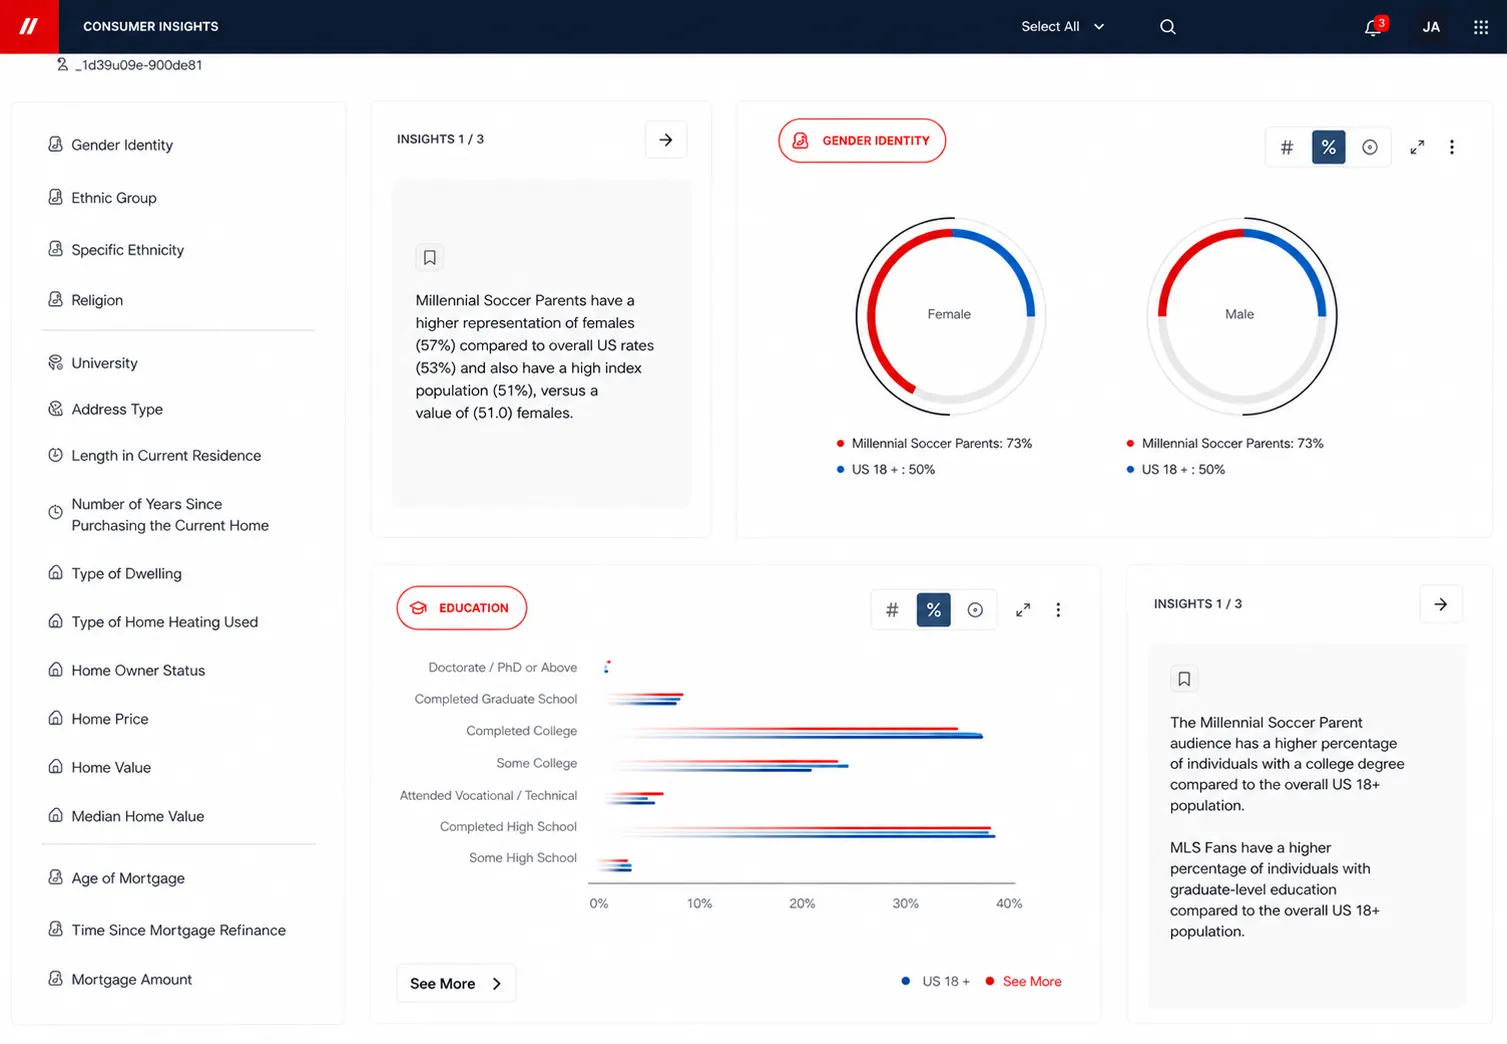
Dashboard with gender identity and education insights comparing Millennial Soccer Parents to US 18+ population.
Trusted by organizations shaping the future of sports, entertainment, and live events

Problem

data is everywhere.
decisions need to happen now.

Woman holding glasses and touching forehead, looking stressed at her laptop in a modern office.

Disconnected systems

Ticketing, CRM, marketing, partnerships, and fan data sit in separate systems, making it hard to see what is driving performance.

Woman wearing glasses searches for documents in a filing cabinet drawer full of manila folders.

Reactive reporting

Manual reports arrive too late, leaving teams to react after pricing, demand, campaign, or revenue opportunities have already moved on.

Close-up of multiple US 100 dollar bills with Benjamin Franklin's portrait.

Untapped revenue signals

Fan, demand, attendance, and engagement data reveal growth opportunities—when your team can access the right signals.

Meet EPIC: the intelligence layer
for modern revenue teams.
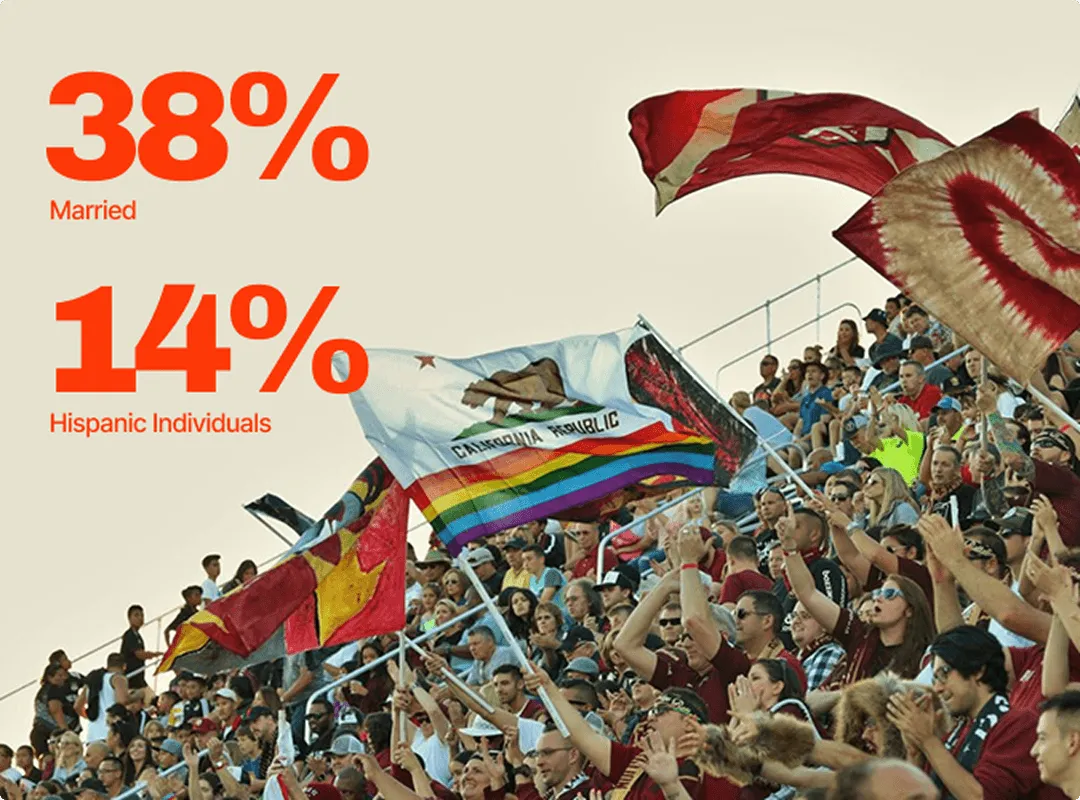
Crowd at an outdoor event waving flags with text showing 38% married and 14% Hispanic individuals.

Act before opportunities pass

Move faster with timely insights that help teams respond to demand shifts, campaign performance, and revenue risks.
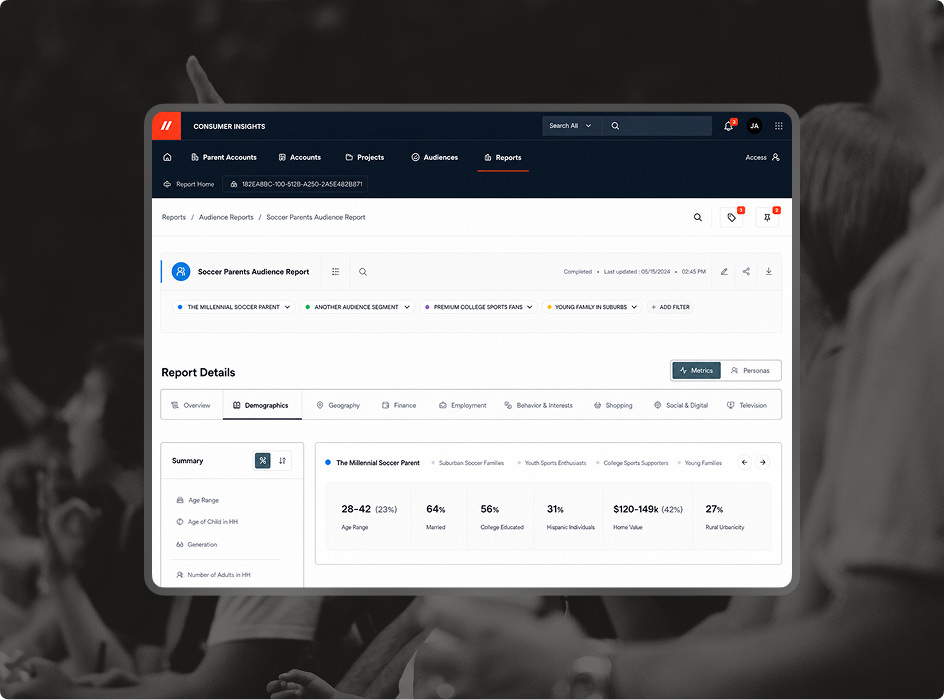
A graphic depicting the dashboard for EPIC.

Real-time reporting

Give executives, sales, marketing, partnerships, and strategy teams a shared view of what matters most.
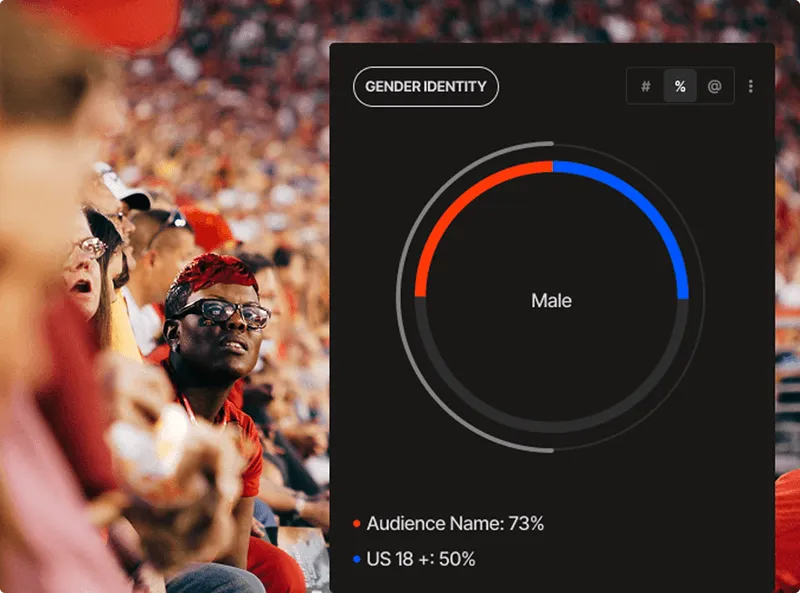
Dashboard showing gender identity chart with Male label and percentage bars for audience and US age 18+.

Turn signals into action

See the ticketing, fan, sponsorship, and market signals that reveal where growth opportunities are emerging.

Platform

From Live Data to
Smarter Decisions.

Real-time analytics

Monitor live ticketing, attendance, campaign, and revenue performance.
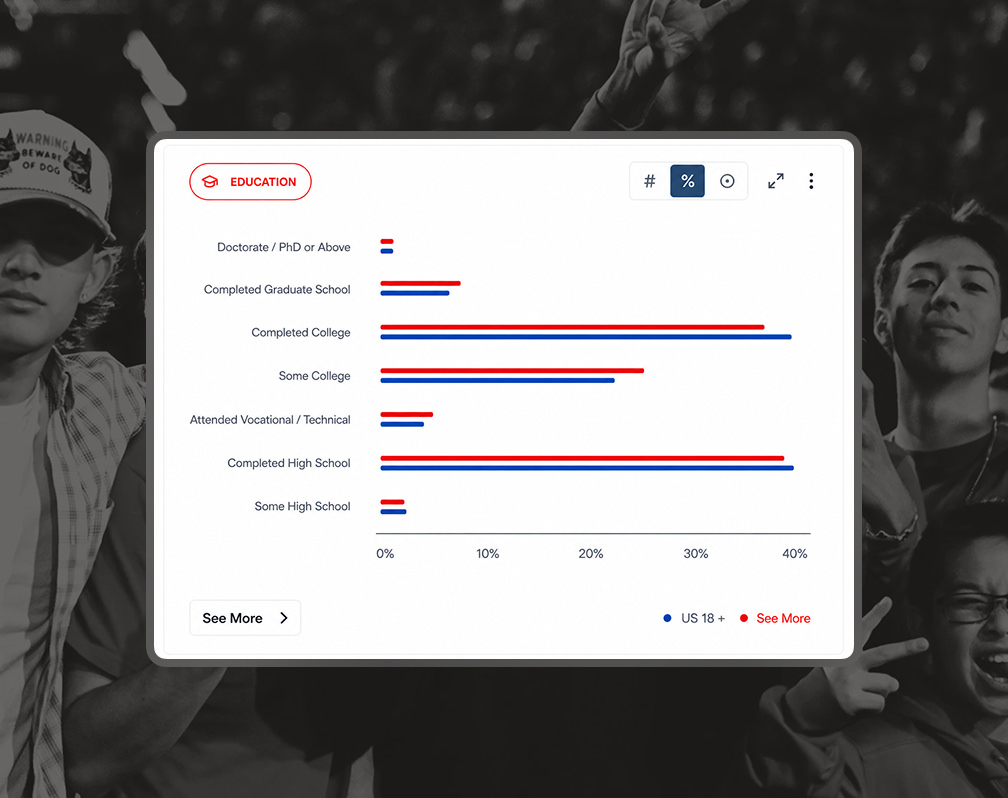
Bar chart comparing education levels with percentages for US 18+ and another group in blue and red.

Audience segmentation

Create fan groups by behavior, value, geography, purchase history, attendance, and engagement signals.
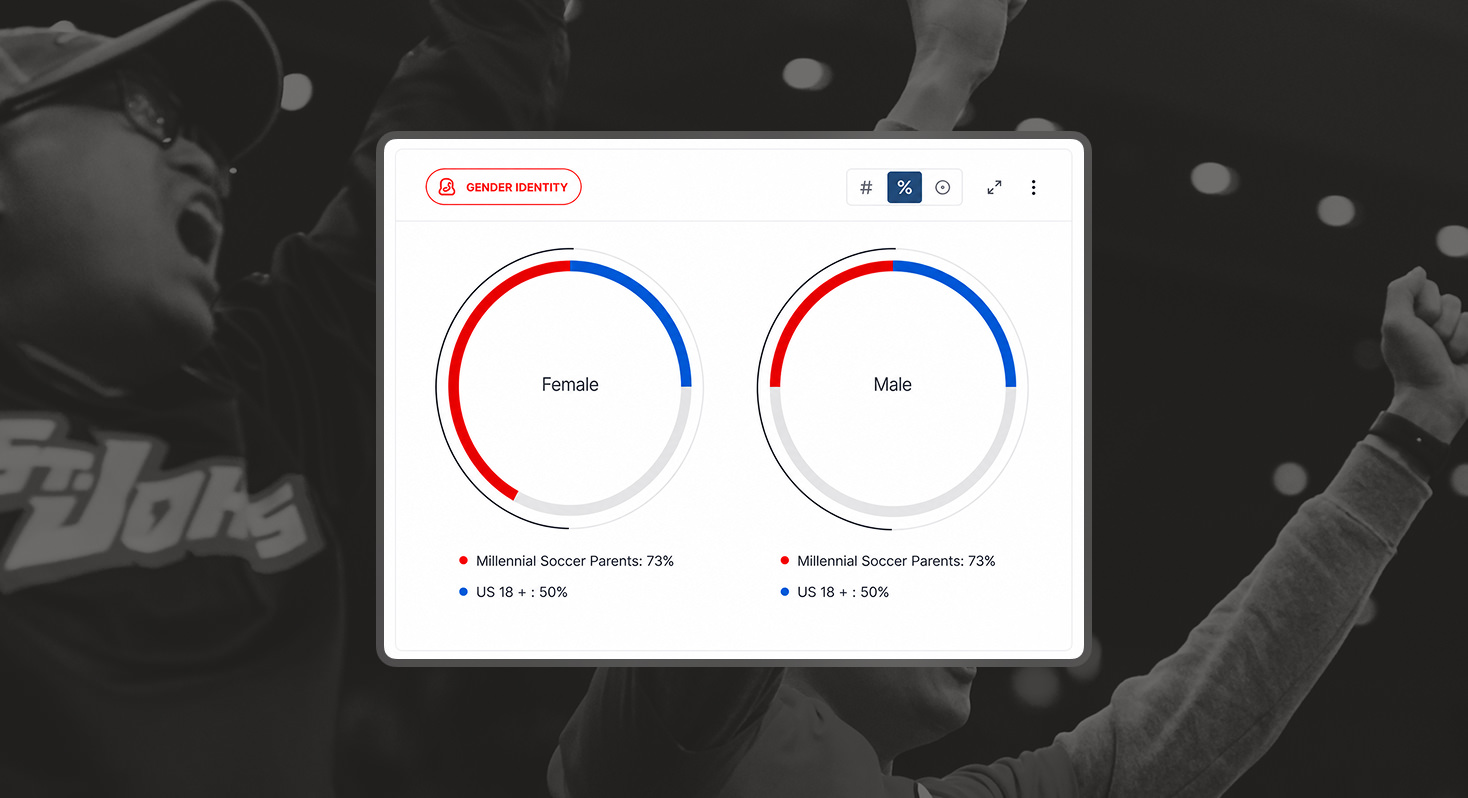
Two gender identity doughnut charts comparing Millennial Soccer Parents and US adults 18+, female and male.

Executive-ready dashboards

Build role-specific views for leadership, ticketing, marketing, partnerships, and strategy teams.
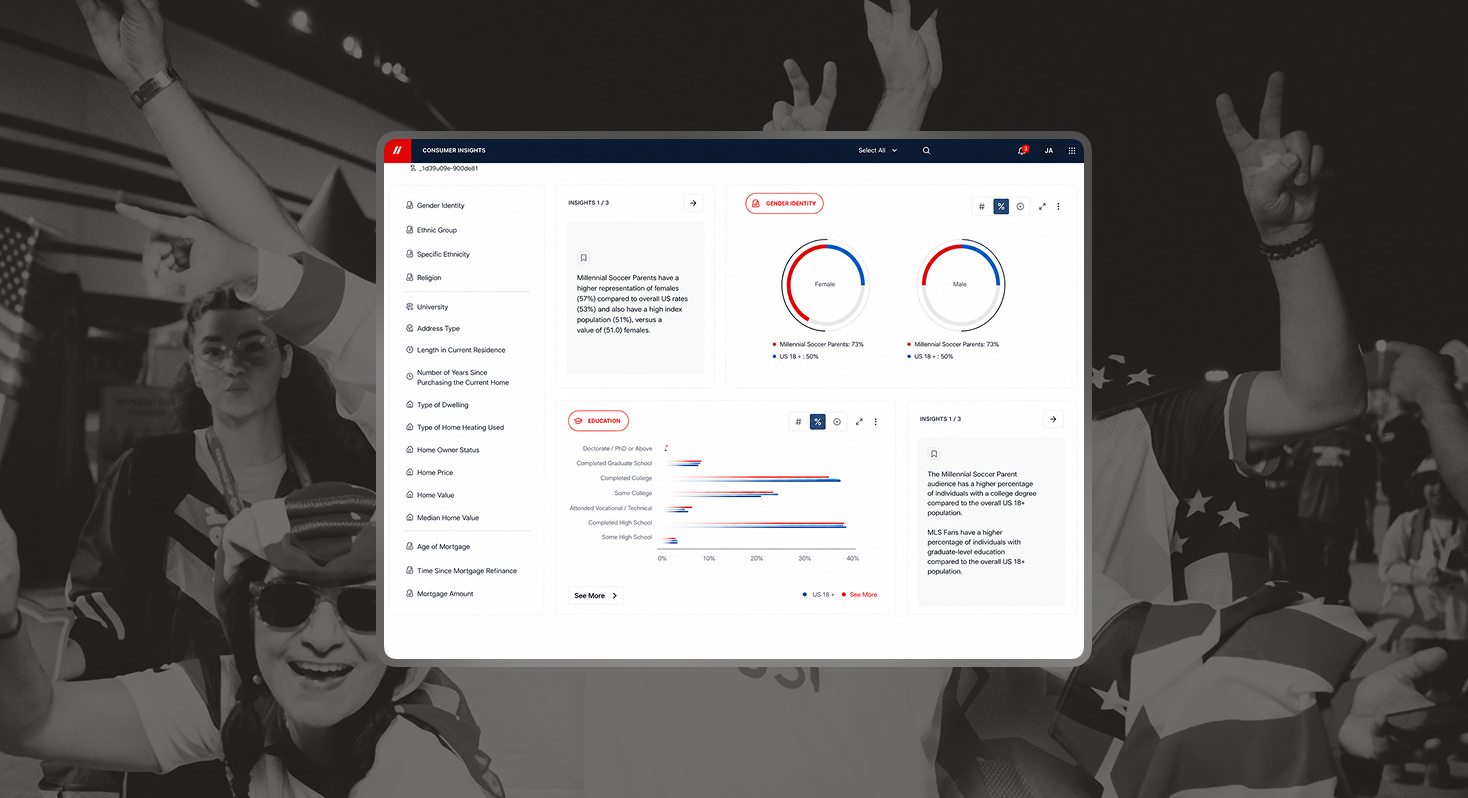
Dashboard screen showing demographic insights with charts on gender identity and education levels.

Automated reporting

Generate recurring reports that turn complex data into clear updates for stakeholders.
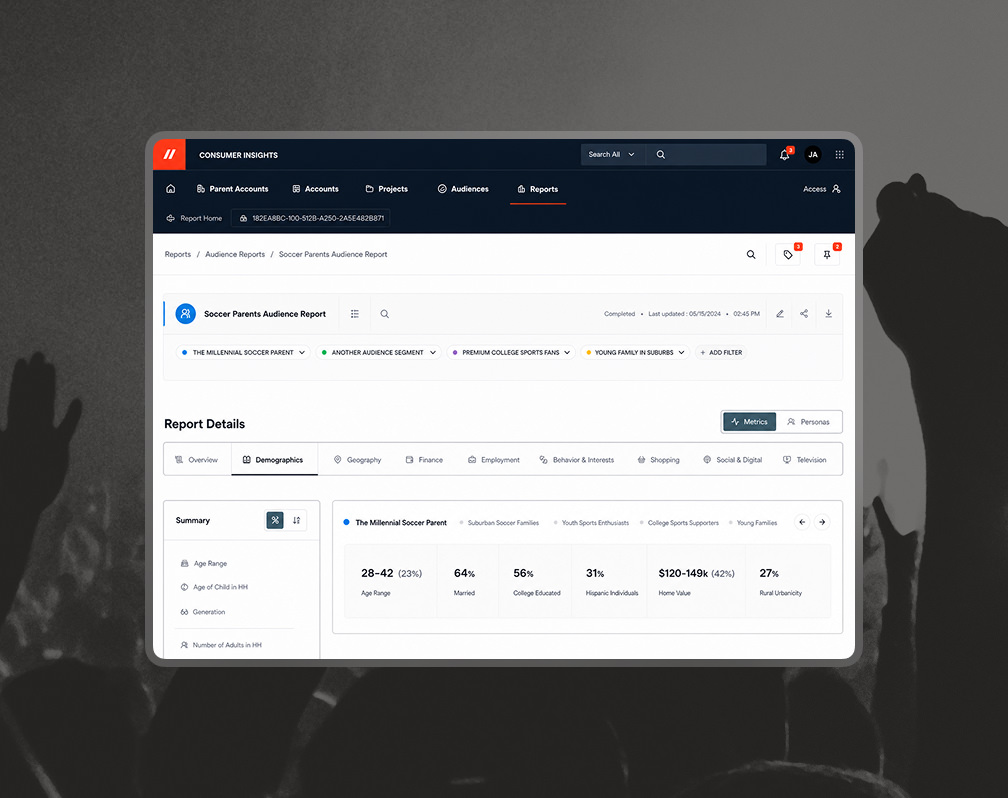
A graphic depicting the EPIC dashboard.

Case Studies

See how leading teams and brands use EPIC to uncover fan insights, sharpen strategy, and turn data into measurable growth.


A hand drawn arrow gesture pointing to the right in orange.
Crowded stadium stands filled with fans watching a baseball game on a green field.

The science of data
meets the art of fandom

19%

More likely to believe that ethical decision making is important in brands

Psychological insights

44%

More likely to trust brands featured on YouTube videos with positive messaging around sustainability

Emotional insights

49%

More likely to purchase brands that donate a portion of their proceeds to education charities

Behavioral insights

Problem

Modular intelligence for every commercial challenge.

EPIC combines software and service to turn insights into execution across your highest-priority needs.
Request a demo
Person typing on a laptop displaying dashboard tiles for insights and management tools.

Consumer insights

Build granular audience profiles and refine engagement strategies

Ticketing Management

Centralize inventory, automate dynamic pricing, and optimize sales with integrations with primary and secondary market platforms

Property Insights

Access actionable data on sponsorship performance, ticket pricing, and venue operations

Team Insights

Leverage disparate data sources to democratize data, generate distributable reports, and reveal AI-driven insights

Experiences Platform

Package, sell, and market premium hospitality end to end, from suite inventory to post-purchase fan data, in one connected system

Compare

Built for the business
of live experiences.

Generic BI tools visualize data. EPIC helps sports and entertainment teams turn it into commercial action.

Generic BI Tools

Visualizes business data
Turns raw data into charts, dashboards, and performance views teams can review.
A black check mark. A grey small check mark.
A grey small check mark.
Supports custom reporting
Allows teams to build reports around business questions, KPIs, and stakeholder needs.
A black check mark. A grey small check mark.
A grey small check mark.
Purpose-built for sports and entertainment
Designed around ticketing, fandom, sponsorship, venues, live events, and commercial revenue teams.
A black check mark. A grey small check mark.
Two black lines formatted perpendicular to form an X.
Connects insights to revenue strategy
Helps teams identify actions across pricing, sales, attendance, partnerships, fan engagement, and growth.
A black check mark. A grey small check mark.
Two black lines formatted perpendicular to form an X.
Usable by operators, not just analysts
Gives executives and commercial teams clear, decision-ready views without requiring deep BI expertise.
A black check mark. A grey small check mark.
Two black lines formatted perpendicular to form an X.
Backed by sports business expertise
Pairs platform intelligence with Elevate’s experience across strategy, ticketing, partnerships, and fan growth.
A black check mark. A grey small check mark.
Two black lines formatted perpendicular to form an X.

News & Insights

DATA-LED INSIGHTS FOR THE NEXT ERA OF FAN ENGAGEMENT.

Explore the latest thinking from EPIC on audience intelligence, fan behavior, sponsorship strategy, and the commercial trends shaping sports and entertainment.
See All News
“The EPIC platform provided us with the crucial data-driven insights we needed to confidently revolutionize our football and men's basketball ticketing and annual giving model. The analysis presented key opportunities and potential challenges, giving us a clear roadmap for this transformational change. This intelligence enabled us to move beyond assumptions and make strategic, informed decisions that simply wouldn't have been possible before. Ultimately, EPIC empowered us to create a more engaging and sustainable model for our loyal fans and donors.”
“We didn’t just study who our fans are, we also studied, ‘Hey, here's what the potential for your fan base is,’ and not just when it comes to selling tickets, but if you're looking for donations, here's the right pool of people that might be interested in that. If you're looking to sell mini-plans – you know premium is a hot topic in the Bay whether you're going to a Warriors game or a 49ers game, people want premium experiences – so that has allowed us to truly go and revamp what that premium experience looks like so that we can take care of the true blue Cal fan, but we can also introduce some new people to our brand that's right there in our backyard.”

FAQs

Questions?
Answers.

What is EPIC by Elevate?
One black line formatted horizontal to form a minus sign. Two black lines formatted perpendicular to form a plus sign.
EPIC is Elevate’s data intelligence platform for sports, entertainment, and live-event organizations. It helps teams connect fan, ticketing, attendance, sponsorship, and revenue data to uncover actionable insights and make faster commercial decisions.
Who is EPIC built for?
One black line formatted horizontal to form a minus sign. Two black lines formatted perpendicular to form a plus sign.
EPIC is built for professional sports teams, leagues, venues, college athletics programs, rights holders, and entertainment properties that need better visibility into fan behavior, ticketing performance, partnership value, and revenue opportunities.
How does EPIC help sports teams grow revenue?
One black line formatted horizontal to form a minus sign. Two black lines formatted perpendicular to form a plus sign.
EPIC helps sports teams identify demand trends, ticketing opportunities, audience segments, pricing signals, attendance patterns, and partnership insights—so commercial teams can act faster and make more informed revenue decisions.
What makes EPIC different from a standard analytics dashboard?
One black line formatted horizontal to form a minus sign. Two black lines formatted perpendicular to form a plus sign.
Unlike generic analytics dashboards, EPIC is purpose-built for the sports and entertainment industry. It combines real-time analytics, audience segmentation, custom dashboards, and automated reporting with Elevate’s expertise in ticketing, strategy, partnerships, and fan engagement.
What types of data can EPIC analyze?
One black line formatted horizontal to form a minus sign. Two black lines formatted perpendicular to form a plus sign.
EPIC can help analyze data across ticketing, CRM, fan engagement, attendance, marketing, sponsorship, revenue, surveys, and market sources, giving teams a clearer view of performance across the full fan and commercial ecosystem.

Unlock your next
winning strategy

Request a demo of EPIC to uncover the fan, ticketing, and commercial insights your team can act on now.

Request a demo